startup-metrics
ai startup
seed-round
How to Benchmark a Startup When There's Almost No Data

Adhrita Nowrin
Mar 20, 2026

Peter Thiel once said that successful people find value in unexpected places by thinking from first principles instead of formulas. He was talking about business generally, but he could have been describing the problem of how to benchmark seed startups.
Traditional benchmarking frameworks don't work on a company with 4 months of revenue, 3 employees, and a financial model that's 80% assumptions. But investors still need to evaluate the deal. Founders still need to prove they're worth the cheque.
Most seed stage metrics advice is built for companies that already have data: Months of revenue, meaningful user numbers and a growth rate we can plot on a chart. At seed, founders often have none of that.
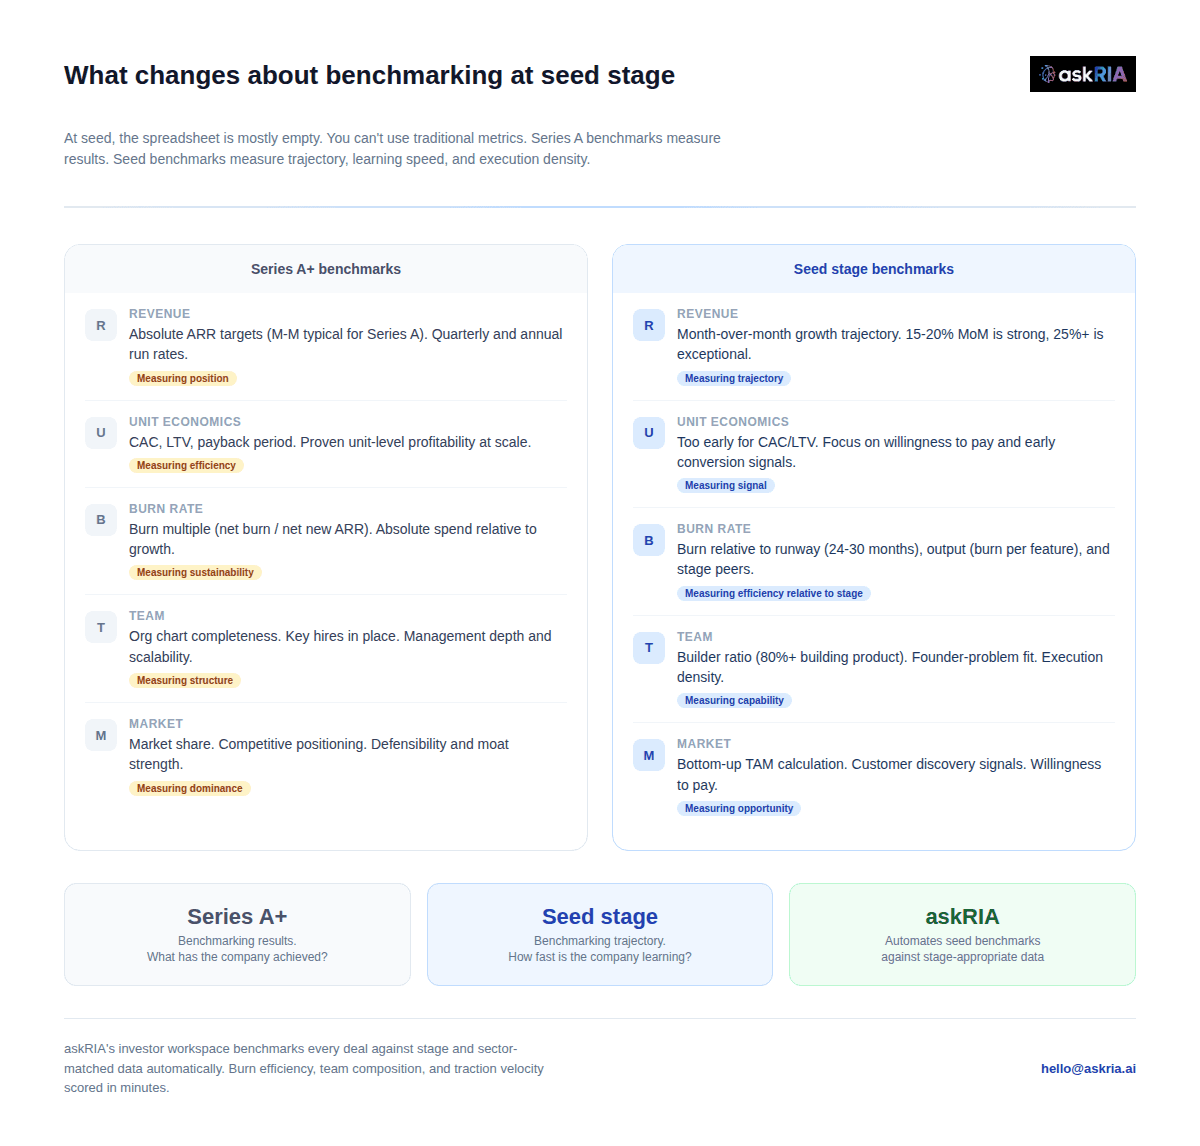
After looking at hundreds of early-stage companies across the UK, US, and UAE, three signals consistently take precedence: burn efficiency relative to stage, team composition relative to ambition, and traction velocity relative to peers. Get those three comparisons right and we have a framework that works even when the spreadsheet is mostly empty.
At seed stage, investors aren't benchmarking position (revenue, margins, scale). They're benchmarking trajectory, how fast the company is learning, shipping, and moving toward product-market fit.
The problem for solo angels is that institutional investors benchmark against their portfolio. They've seen 200 companies at this stage. They know what "good" looks like because they have internal data. Solo angels seeing 10-15 deals a year don't have that pattern recognition. Which is exactly why stage-appropriate benchmarking data matters more for them, and why we built askRIA's investor workspace to automate these comparisons.
The seed-stage baseline (2025-2026 data)
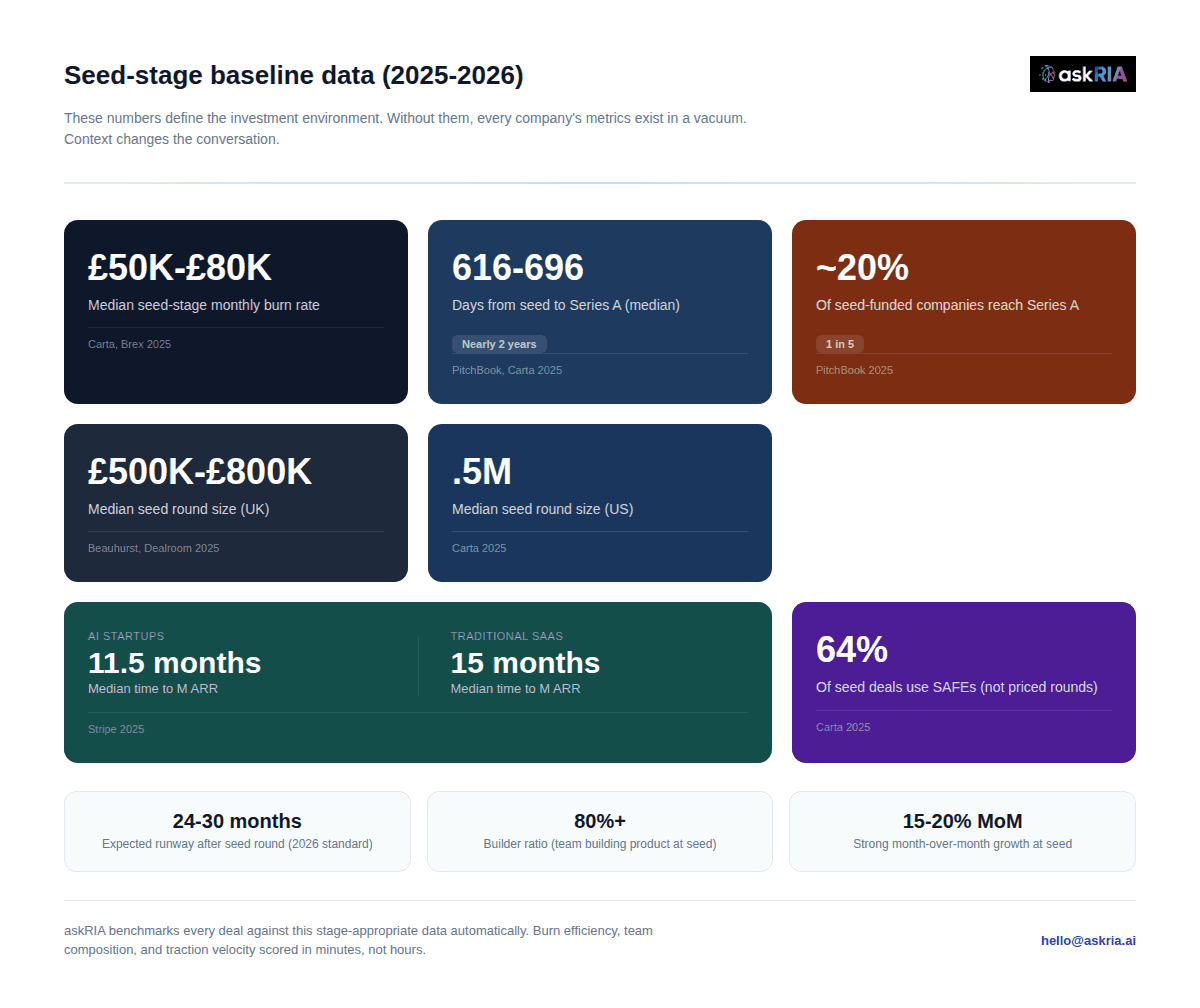
These numbers define the environment. £80K monthly burn sounds fine until we learn the median is £60K for that stage and sector. askRIA's investor workspace benchmarks every deal against this kind of stage-appropriate data automatically, so angels aren't evaluating companies in isolation.
Benchmark 1: Burn efficiency
Burn rate is the most misunderstood seed stage metric. Founders think lower is better. The picture is more complicated.
Pre-seed companies burn a median of about £20K per month (2-3 people, often underpaying themselves). Seed companies burn £50K to £80K per month. AI-focused companies add 40-60% because compute costs start on day one.
But the raw number tells us almost nothing. Burn rate becomes useful when measured against three things:
Burn relative to runway. The modern expectation is 24-30 months of cash after a seed round. Not 12-18. That old rule is dead. PitchBook's data shows the median gap between seed and Series A hit 696 days as of Q2 2025. Runway that doesn't reflect that reality is a plan built on wishes. askRIA calculates effective runway from uploaded financials and benchmarks it against current fundraising timelines automatically.
Burn relative to output. A company burning £80K/month with 2 engineers shipping weekly is a different animal from one burning £80K with 5 people and a product that hasn't changed in 8 weeks. Two useful proxies: burn per employee (£80K ÷ 3 people = £26.7K vs £80K ÷ 7 = £11.4K - same burn, very different story) and burn per shipped feature (8 updates last quarter at £80K/month = £30K per feature; 2 updates = £120K per feature).
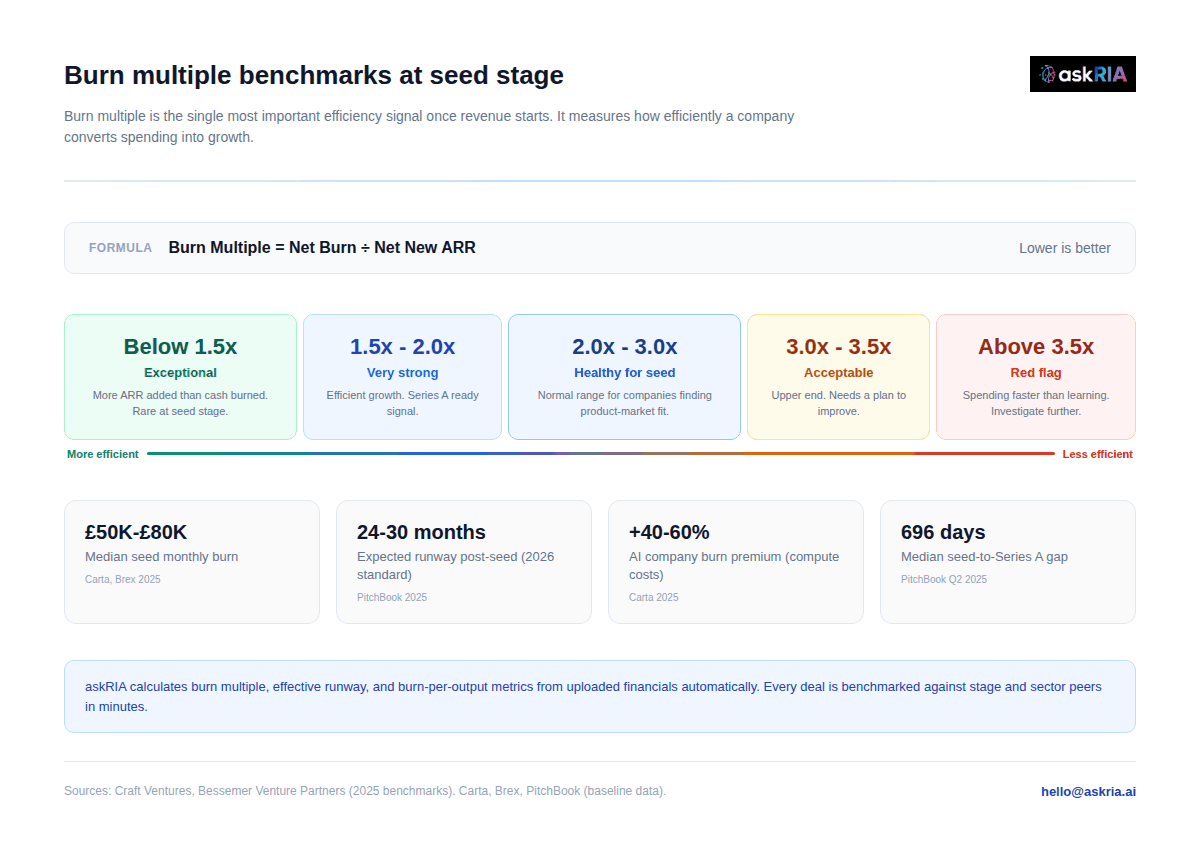
Burn multiple (for companies with early revenue). Net burn divided by net new ARR. This is the single most important efficiency signal the moment revenue appears.
askRIA's workspace scores burn efficiency against all three dimensions automatically. The angel sees where the company sits relative to comparable deals at the same stage, not in a vacuum.
Benchmark 2: Team composition
This gets the least attention and probably matters the most. At seed, team composition isn't about org charts. It's about whether the founding team can actually build what they're describing.
Founder-problem fit: Map the company's top 3 technical challenges against the founding team's backgrounds. If a company is building an AI-powered fintech product and nobody on the team has worked in financial services or built ML in production, that's a gap worth benchmarking against peers.
Builder ratio: The percentage of the team that's actually building product versus doing sales, ops, or management. At seed, 80%+ should be building. If more than 30% of the team is in non-building roles, the company is structured like a Series A business running on seed money. That mismatch kills companies.
Benchmark 3: Traction velocity
Traction velocity is the rate of growth. Nobody expects £500K MRR at seed. But they expect movement. The question: how fast is the line going up relative to comparable companies at the same point?
For companies with revenue: 15-20% month-over-month growth is strong. 25%+ is exceptional (top decile, Series A conversations start early). Below 10% is concerning. AI startups reach $1M ARR in a median of 11.5 months (Stripe 2025). Traditional SaaS takes 15 months. If an AI company hasn't hit £100K ARR after 18 months, that's below the median pace.
For pre-revenue companies: Product iteration speed (12+ meaningful updates per quarter is strong, under 4 is slow), waitlist growth (20%+ weekly with minimal paid acquisition is a signal), beta user retention (60%+ at 30 days means something is working), and LOI conversion rates.
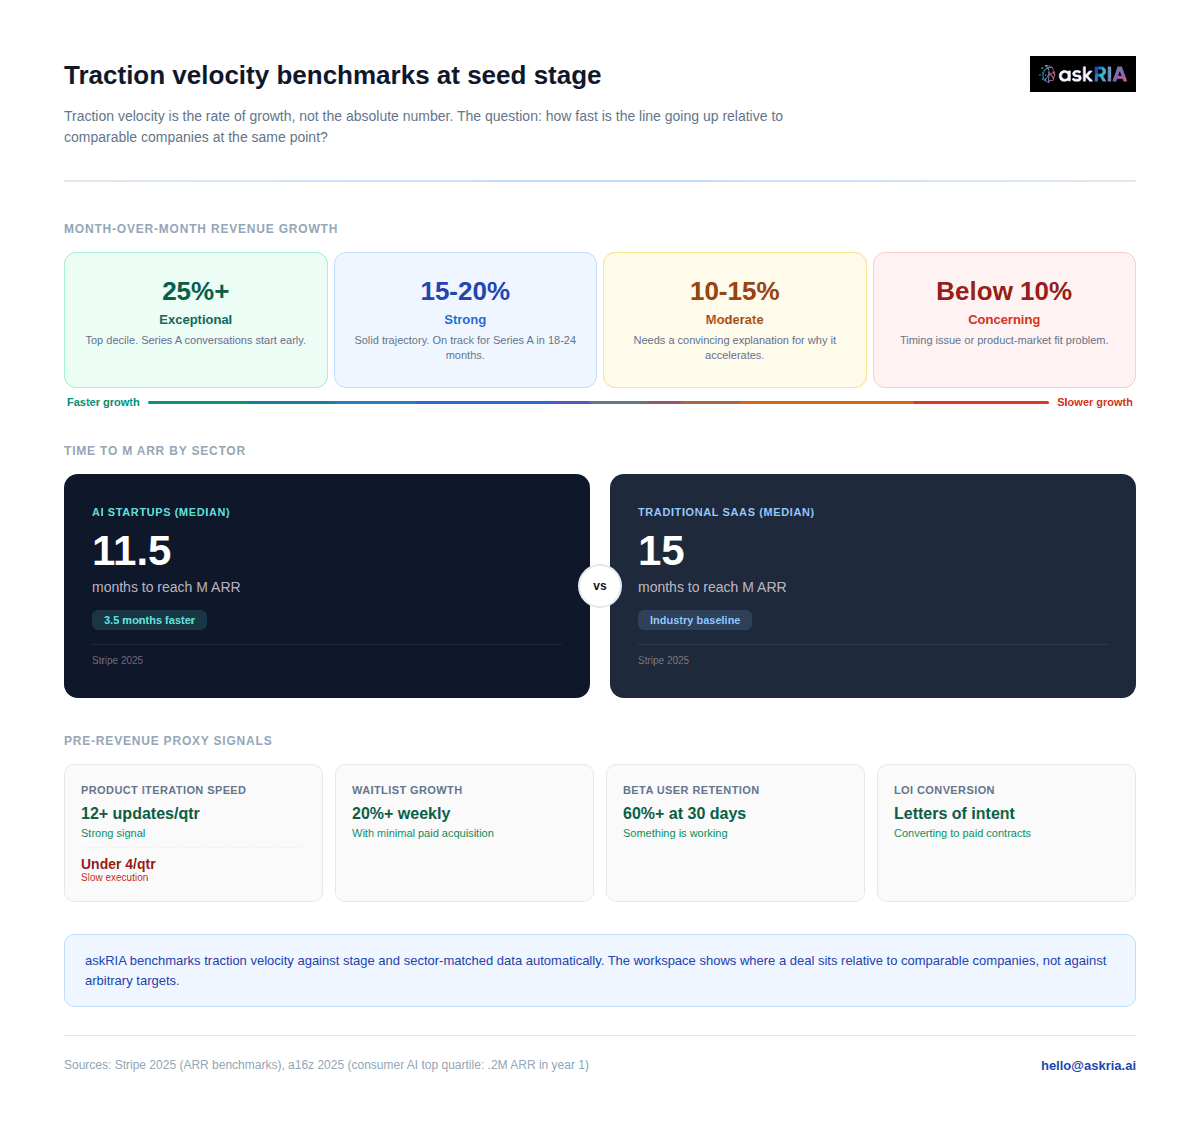
askRIA benchmarks traction velocity against stage and sector-matched data. The workspace shows where a deal sits relative to comparable companies, not against arbitrary targets.
The three questions that actually matter
This framework reduces the process to three questions regardless of whether it’s a first-cheque angel or a partner at a £50M fund:
Is this company burning efficiently for its stage? (Check burn against runway, output, and burn multiple)
Does this team have the composition to build what they're describing? (Check builder ratio, founder-problem fit, team size vs output)
Is traction moving at a rate that suggests product-market fit is discoverable? (Check MoM growth, iteration speed, pre-revenue proxies)
If all three answers are yes, the spreadsheet gaps matter a lot less. If any answer is no, we know exactly where to push in the founder conversation.
askRIA's investor workspace runs all three benchmarks automatically on every deal. When documents hit the workspace, the system scores burn efficiency, team composition, and traction velocity against stage-appropriate data, flags the gaps, and produces a structured benchmarking report. The angel's job is reading the scores and asking the right follow-up questions, not building the comparison from scratch.
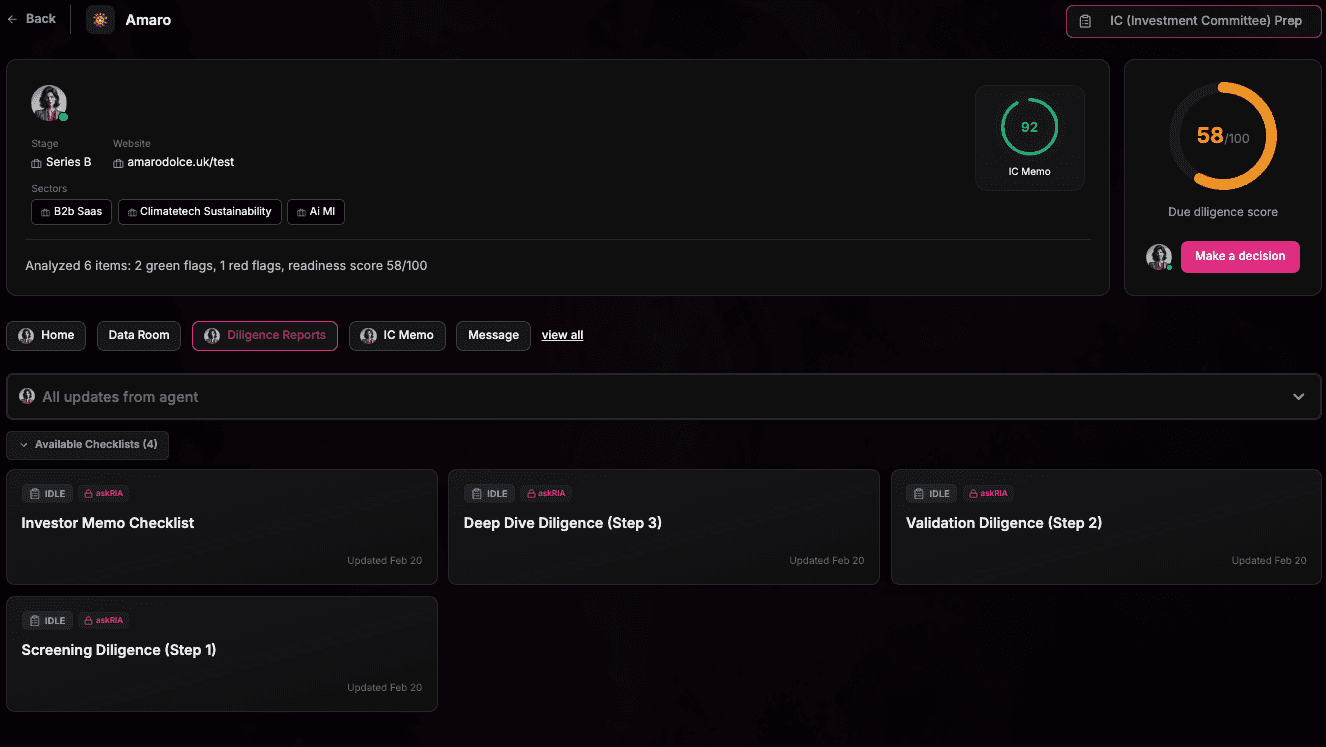
For Solo angels and syndicate leads, askRIA benchmarks each deal against stage-appropriate data automatically. Burn rate compared to median for that sector and stage. Team composition scored. Traction velocity plotted against comparable companies. No spreadsheet required.
For Founders: askRIA's Investor Readiness Score runs the same benchmarks on a company before they go to market. They can see exactly how they compare, where the gaps are, and what to fix before the first investor meeting.
PE firms, family offices, and institutional funds (enterprise): The same infrastructure scales. Custom benchmarking agents deployed in your environment, on your preferred LLM. Contact hello@askria.ai for enterprise pricing.
Frequently asked questions
What are early stage startup benchmarks? Early stage startup benchmarks are the metrics investors use to evaluate seed companies when traditional financial data is limited. The three primary benchmarks are burn efficiency (burn rate relative to runway and output), team composition (builder ratio and founder-problem fit), and traction velocity (month-over-month growth and iteration speed). These measure trajectory rather than position. askRIA's investor workspace automates these comparisons against stage-appropriate data.
What seed stage metrics should investors focus on? Burn multiple (net burn / net new ARR, targeting 2.0x-3.0x), runway length (24-30 months is the 2026 standard), builder ratio (80%+ building product), and MoM growth rate (15-20% is strong, 25%+ is exceptional). For pre-revenue companies, product iteration speed and beta user retention are the best proxies. Carta, Stripe, and Bessemer publish annual benchmark data.
How do you benchmark a startup with no revenue? Use proxy metrics: product iteration speed (12+ meaningful updates per quarter is strong), waitlist growth rate, beta user retention (60%+ at 30 days), LOI conversion rates, and bottom-up market sizing. Compare against companies at the same stage and sector.
What is a good burn rate for a seed-stage startup? Median seed-stage burn is £50K-£80K per month (Carta, Brex 2025). AI companies burn 40-60% more due to compute. More important than the raw number: does the burn support 24-30 months of runway, and is output proportional to spending?
What is burn multiple and why does it matter? Net cash burned divided by net new ARR in the same period. At seed: below 2.0x is exceptional, 2.0-3.0x is healthy, above 3.5x is a red flag (Craft Ventures, Bessemer 2025). The single most important efficiency signal once revenue starts.
Can institutional investors use the same framework? Yes. The three-benchmark structure applies at any scale. For PE firms, family offices, and funds, askRIA provides automated benchmarking, financial verification, and red flag detection across multiple deals. Contact hello@askria.ai for enterprise pricing.
For founders: get your Investor Readiness Score at askRIA. See how you benchmark before investors do. For investors: askRIA's workspace benchmarks every deal against stage-appropriate data automatically. Book a free 20-min demo at Calendly link or email hello@askria.ai.